Tuesday, 28 April 2015

Tableau Interview Questions Part-1


Tableau Interview Question Part-1:
     1) Difference between tableau extensions .twb and .twbx:

Twbx:

1. .twbx file is a Tableau Packaged Workbook, meaning it is the original .twb file grouped together with the datasource(s) in one package.

2. .twbx files can be considered analogous to specialized zip files, in which these “zip” files contain all the information necessary to work in Tableau.

3. The primary advantage to using .twbx files is that analysis can be performed without network/internet connections to your data because your data is already present on your computer in this packaged file.

Twb:


1. The .twb file alone is not enough to perform any analysis because it only contains Tableau’s instructions for interacting with a datasource.

2. In actuality, .twb files are XML files specially tailored to interact with datasources.
They are custom built to make the awesome visualizations that Tableau generates.

 2)  What is the Dimensions and Measures?

Dimension: A dimension is a field that can be considered an independent variable.
Dimensions typically produce headers when added to the rows or columns shelves in the view. By default, Tableau treats any field containing qualitative, categorical information as a dimension. This includes, for instance, any field with text or dates values.

This means that a measure can be aggregated for each value of the dimension. For instance, you might calculate the Sum of “Sales” for every “State”. In this case the State field is acting as a dimension because you want to aggregate sales for each state. The values of Sales are dependent on the State, so State is an independent field and Sales is a dependent field.

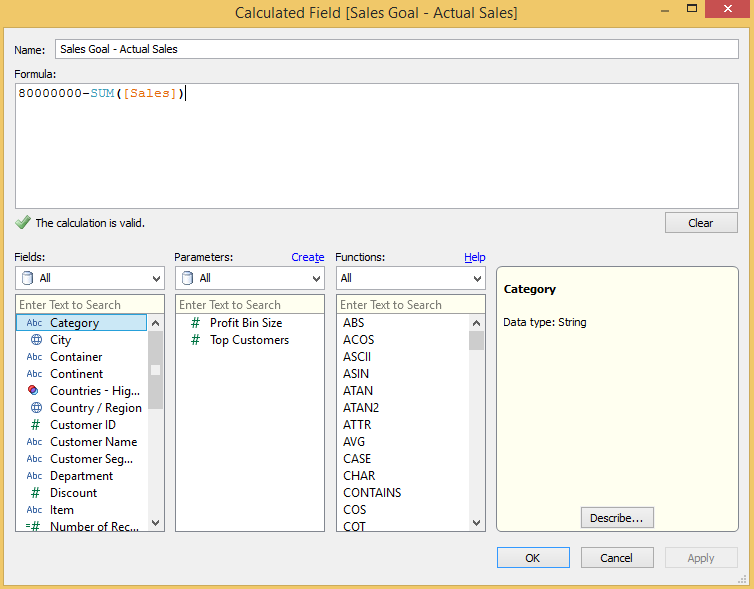
Measure:A measure is a field that is a dependent variable; that is, its value is a function of one or more dimensions.

Measures typically produce axes when added to the rows or columns shelves. By default, Tableau treats any field containing numeric (quantitative) information as a measure.

This means that a measure is a function of other dimensions placed on the worksheet. For instance, you might calculate the Sum of “Sales” for every “State”. In this case, the Sales field is acting as a measure because you want to aggregate the field for each state. But measures could also result in a non-numeric result. For instance, you might create a calculated measure called “Sales Rating” that results in the word “Good” if sales are good and “Bad” otherwise. In this case the “Sales Rating” field acts as a measure even though it produces a non-numeric result. It is considered a measure because it is a function of the dimensions in the view.

--------------------------------------------------------------------------------------------------------------------------

There should be a common dimension to blend the data source into single worksheet.

For example, when blending Acutal and Target sales data, the two data sources may have a Date field in common. The Date field must be used on the sheet. Then when you switch to the secondary data source in the Data window, Tableau automatically links fields that have the same name. If they don’t have the same name, you can define a custom relationship that creates the correct mapping between fields
.
--------------------------------------------------------------------------------------------------------------------------


1. Use an extract:
2. Limit your dashboard to fully answering only one scenario:
3. Limit the data being introduced to each worksheet:
4. Remove components that add no value:
5. Eliminate any non-essential components from the visualization
-------------------------------------------------------------------------------------------------------------------------------------

More Extracts, filters and depends on data sources
----------------------------------------------------------------------------------------------------------------------------------------


There won't be any joins as such but we will just give the column references like primary and foreign key relation.
----------------------------------------------------------------------------------------------------------------------------------------


In Tableau, the relative date filter enables flexible analysis of time periods. Sometimes, however, you might want to see both year-to-date (YTD) and month-to-date (MTD) values for a particular measure on the same view. To accomplish this task, you can create date calculations.

------------------------------------------------------------------------------------------------------------------------------------------

No
---------------------------------------------------------------------------------------------------------------------------------------


------------------------------------------------------------------------------------------------------------------------------------------
Tableau Reader is a free viewing application that lets anyone read and interact with packaged workbooks created by Tableau Desktop
------------------------------------------------------------------------------------------------------------------------------------------
Tableau Server is a business intelligence solution that provides browser-based visual analytics anyone can use at just a fraction of the cost of typical BI software. With just a few clicks, you can publish or embed live, interactive graphs, dashboards and reports with current data automatically customized to the needs of everyone across your organization. It deploys in minutes and users can produce thousands of reports without the need of IT services — all within your IT infrastructure.
-----------------------------------------------------------------------------------------------------------------------------------

Normal Filter:- This is used to restrict the data from database based on selected dimension or measure. If you drag a dimension into filter shelf you can filter the data by selecting list of values. when dragging by  measure you can select a range of values.

Quick Filters:- what ever you have applied filter, if you want give a chance to user for dynamically changing data members at run time this is useful. In this you are able to see only non restricted data members only.

OR

The quick filter is a representation of filter to play around and normal filter will not be shown in the workbook to play around.
--------------------------------------------------------------------------------------------------------------------------------------

Thursday, 16 April 2015

New user interface enhancements in Tableau Desktop 9

A lot of us are playing around with the new features and are already benefitting from the advancements they bring. Today, I’m kicking off this blog series with a look at the user interface changes and improvements.
v9-Home-ScreenClick the image to view bigger.
This is one of my longer blogs so I’ve added this contents so that you can jump to what you are interested in, otherwise please keep reading.
If you’ve had the opportunity to download Tableau v9 Beta 2, you’ll no doubt have realised that it’s pretty great. For all those who haven’t, get involved and start downloading!
In Tableau Desktop 9, there are some fantastic UI improvements that Tableau have made. The majority of it is increasing the usage of drag-and-drop and buttons rather than menus. This is a testament to the way Tableau listens to their customer base and makes the best decisions in each release. So, keep reading to find out some of the look and feel of Tableau v9 (Note: It’s a beta, and things may change before release).

New Home Screen

It’s got a lovely, blue, fresh design, incorporating the Home screen from previous versions with the Connect to Data screen.
v9-v8buttons
You will also notice the “Sheet, Thumbs, Data, Home” buttons  have been removed and a new “Tableau Logo” button added to the top-left.
v9-Home-Button
Click this and it flicks between the new Home screen and your last-used worksheet. On this new Home screen, you can Connect to Data, View Server Workbooks, Discover community workbooks and view the “Viz of the Day” from Tableau’s website. It’s a great change as, in my opinion, it simplifies the workflow.
The thumbnail view button now has a new home in the bottom-right of the Tableau app. Its size and position, I guess, denotes it importance. However, it’s still useful.
New connectors that I’ve spotted are SPSS .sav, SAS .sas7bdat, R .rda and R .rdata, MonetDB and SparkSQL. I’ll be blogging about the R connectors very soon, as it’ll be great to have an R script pulling data from Twitter, analysing it and then visualising in Tableau!

Connect to Data Screen

The “Go To Worksheet” button has disappeared!
v9-Go-To-Worksheet
But, you can relax. Tableau decided it was redundant, and you now use the sheet navigator at the bottom of the screen to go to a sheet. I personally prefer its simplification of the interface, as previous versions had too many ways to do something.
v9-Data-Source-Button
A new “Manage metadata” button has also been added. This opens a view of the fields/columns in your data, allowing you to rename, describe and change aliases in the data and split the data in a column. This feature is a great new addition for shaping your data in Tableau rather than an external app.
v9-Metadata-Button
Split function: This gives you the ability to split a field/column into separate fields/columns based on a separator. For example, I have an ID field in a database that is stored “#01-16845”. The key of the row is really the 16845. So, let’s say I want to split the field on “-”. I can do this now with the Split function, giving me a new column containing “16845”. We’ll be talking more about these new data shaping tools (Split and Pivot) in a following blog, so keep an eye on the blog for updates.
Show Aliases button: If you’ve set any aliases against your data, you can switch them on and off in the data to check the underlying data – useful.

General Navigation

I’ve already mentioned the new position for the Thumbnails view button in the bottom-right and the removal of the navigation buttons in the top right, and you’ll see by doing that the workspace is that little bit bigger. In the end, the data is the star, and the user interface should blend into the background. I feel it does.
I’m loving the new “Tableau Logo” Home button, so I’ve just mentioned it again ;).
Data Source button: This is a shortcut for the old “right-click on the data source and then click Edit Data Source”, it’s another improvement to the workflow that potentially reduces the number of clicks to do things.
“Hide all sheets”. Yay!!! This one is in the right-click menu of a dashboard tab, and it does what it says on the tin – hides all the sheets used in that dashboard. There’s an Unhide all sheets too.
v9-Hide-All-Sheets
Sheet preview when building dashboards, hover over the sheet in the left navigator and Tableau now displays a thumbnail of the sheet. Great for finding those cryptically named sheets. (Sheet 1, Sheet 2 etc. all you non-namers.)
What’s that new icon on the right of the sheet tabs I hear you ask?!.
v9-Story-Button
It’s the new “New Story” button. Again, one less click and less use of menus. This lower dependence on menus is great in OSX as the menu bar is always at the top of the screen rather than attached to the window as in Windows.

Maps

A few new features here; and the “Tableau Classic” map has been removed from the Map Options. Out with the old altogether.
Hover over the map and the map toolbar is shown, the first button is a search tool allowing you to search for geographic locations around the globe.
Lasso tools have been improved in maps, there is now a circular and freeform polygon tool to select marks on a map.

Tooltips

Responsive tooltips: They appear as you move the mouse around marks. It looks and feels much quicker as there’s no need to hover over a mark, then wait and then read the tooltip. You can still choose the hover tooltips, though. The command buttons are hidden when using responsive and only appear when clicking on the mark –
makes the interface cleaner.
v9-Tooltip
“Show Tooltips” button: This removes the need to delete the contents of a tooltip just to switch it off. A far more explicit and understandable method.
v9-Tooltip-Editor

In-line Editing

We’ll be telling you more about this in a further blog; however, this is a lovely method for creating calculations on the sheet. You can even create a calculation on a sheet and not have it appear in the dimensions and measures, keeping your metadata tidy. Then, when you’ve tested it, you can easily create a dimension or measure from it by dragging it to the Metadata window.
v9-Code-Completion
The in-line editing works on columns, rows and marks at present. Let’s hope Tableau add it to the Filters and Pages shelf soon.

Calculated Field Editor

This one looks completely new with a flat, clean design, and the best bit is that it takes up far less space making the viz visible below. Hey, Tableau, how about a semi-transparent window ….v9-Calc-Editor
You’ll notice the help windows for functions, etc. have gone. Well, they’re now available by clicking the arrow button on the right of the window.
v9-Calc-Help
Code completion: This is great for those of you who code in IDEs (well, great for everyone really). Start typing into the window and Tableau suggests items you can add. So, start with “[S”, and a list of dimensions and measures is shown, named with the first letter S from all data sources. Arrow key down to the one you want and hit Tab. Voila! Code completed!
Cancel button is now an X in the top right.

Analytics Panel

Next to the “Data Window” button is a new “Analytics” button. Click this, and you get a new view with various analytic functions available for drag and drop. Click the one you want, and drag it to the view. When you drag it over, a new Scope window appears. Drag it to “Table, Pane or Cell” to set the scope. Far, far better than digging around in Windows and Menus.
v9-Analytics-Pane

Story Points

The interface works as before; however, you can now resize the grey navigation boxes at the top. It makes the interface cleaner. I quite like just having 1, 2, 3 for each of the points and a description to go with each one. Tableau, can we justify the navigation buttons left, center and right rather than them being stuck in the middle?
v9-Story-Nav

And One More Thing …(this one’s a bit geeky)

The grey used in various places is lighter. It was RGB 231,231,231 but is now 242,242,242. Makes everything feel like a lighter and happier place to be :).
So, there we have it. Tableau v9 is a great improvement from a user interface point of view. There is lots more to learn under the hood, but that’s for another blog post. Keep an eye out for the rest of our blog series for more info on Tableau Desktop and Tableau Server v9.
Source : Interworks

Comparing Performance on Tableau 8.3 Server vs Tableau 9.0 Server

Individual Query time improved by 10x
Dashboard Query times improved by 9x
Query Fusion improving times by 2x
And Query Caching improving times by 50x

For more details  refer: http://interworks.co.uk/blog/comparing-performance-tableau-8-3-server-vs-tableau-9-0-server/

What is new in Tableau 9.0 version

Firstly, for all those still on Windows Server 2003 (you know who you are), it’s time to finally upgrade as Tableau Server 9.0 won’t run on this OS.
New User Interface
The first thing that you will notice when connecting to the Tableau 9.0 server is the new user interface. The login screen now has a clean minimal new look
Login Screen
and the overall user experience has been completely redesigned with a new sleek black theme to it, at a glance looking like the InterWorks site ;).
MainScreen
Instead of having to page through your Workbooks (or your Views, etc) they are now all on the same page, with infinite scrolling.
Also, searching has been improved with the facility to search all projects, workbooks, views or data sources in one filter.
 Search
All of these design changes are also reflected in the Administrator View.
Security Permissioning
User and Group Permissioning has been improved with a new layout which makes changing permissions easier to understand. You can now instantly see the effects of changing group permissions, and what rights the individual users have.
Permissions
Command Line
For all you scripters out there, Tabcmd is now more responsive for faster batch line programming. The REST API has also been expanded with a number of new functions.
High Availability
Cluster management has improved greatly, so that now you can manage and control fail-overs, and set preferred hosts. This is great news for all those who were frustrated with the rudimentary nature of the previous version.
Also, the restrictions on the number of data engine nodes in a cluster and which were passive has been removed, with all data engine nodes now being active, resulting in the cluster being more scalable.
Performance Enhancements
All the above points are great, but let’s now dive into the most important improvements, and enhancements that I’m most excited about. These are all about performance. Having Dashboards that render quickly is key for Tableau Server.
The improvements break down into two main areas:
Getting more out of the Server processor cores by;
  • Running multiple queries in parallel on Dashboards, instead of sequentially.
  • Rewriting the underlying code to take advantage of modern CPU design and architecture.
  • Using multiple processor cores for tasks to return results more quickly.
Getting more out of the Server Cache by;
  • Saving and reusing query results for Tableau Extracts, instead of re-running each time a workbook is opened.
  • Recognising related queries in a Dashboard, and optimising the query execution order to increase the number of time cache is being used.
  • Creating ‘shadow’ extracts of Text and Excel Data sources, so that they are optimised.
So, all in all, a number of excellent improvements from Tableau with this new release. There is so much more to go into, but I’ll leave this for another blog. But, what are your thoughts on 9.0’s Server enhancements? Let us know in the comments section as we’d love to hear your views. If you have any questions, please feel free to send me an email or, if you’re ready to download Tableau, click here to get started on a free 14 day trial.

Source : INTERWORKS  Blog

Wednesday, 15 April 2015

How to make Donut charts in Tableau

When used properly, donut charts can be an effective way to communicate comparisons in a unique way. When used improperly, they are the butt of jokes mentioned in the same vein as pie charts. In fact, donut charts are essentially pie charts with a circle in the middle, and in our data visualization tips series, I explain why you shouldn’t use pie charts.
So what’s the difference with donut charts?
One of my recommendations for practitioners that cannot quite let go of pie charts is to use five slices or less. Personally, I would not use more than two. When used for the specific purpose of showing a metric’s progress to goal, with one “slice” being the current state of the KPI and one “slice” being the remainder to goal, I think a donut chart works well.
I admit, a bullet graph would be the most efficient way to communicate the progress to goal scenario above. In other words, a bullet graph would be processed faster by end users than a donut chart and also take up less real estate on a dashboard. If you think a bullet graph may be a more appropriate choice for your data visualization, see How to Make Bullet Graphs in Tableau.
That being said, I don’t mind the extra real estate that a donut chart takes up because that space can be used to provide additional context in a visually appealing way. For example, you can place an icon that denotes what the donut chart applies to or a callout number that shows the percent your KPI has progressed to goal. Donut charts are an acceptable alternative chart type that can make your data visualization stand out. For more on making your work ‘remarkable’, see tip twelve in our Data-Driven Storytelling series, Balance Data and Design.
Looking to maximize the return on your company’s investment in Tableau? Learn about our Tableau TrainingW TO MAKE DONUT CHARTS IN TABLEAU
Step 1
For the purposes of this exercise, we will make a gauge showing how our sales are progressing towards goal. I am using the Superstore sample data in Tableau. This data already contains a measure for ‘Sales’, but we will need to create one more field that calculates the sales goal minus the actual sales. The data you are working with may contain a measure for ‘Sales Goal’, but I am going to hard code a goal of $80,000,000 into my calculated field: $80,000,000 – SUM([Sales]).
Tableau Donut Charts 1
The reason we make this calculated field is so the two slices in our donut chart will always add up to the total goal, and actual sales will always by a correctly sized portion of the total goal.
Step 2
You will now create a pie chart using two measures: ‘Sales’ and the newly created ‘Sales Goal – Actual Sales’. Do this by first changing the mark type on your view to Pie. Now place ‘Measure Names’ on the Colors marks card and ‘Measure Values’ on the Angle marks card. Finally, filter the view on ‘Measure Names’ to only include ‘Sales’ and ‘Sales Goal – Actual Sales’. At this point, your view should look like this:
Tableau Donut Charts 2
Step 3
Format the donut chart (currently a pie) by increasing the size, adding a border, and most importantly: coloring the ‘Sales’ measure to a color of your choice and the ‘Sales Goal – Actual Sales’ measure white. This will eventually create the filling gauge effect we are going for.
Tableau Donut Charts 3
Step 4
The final step in creating a true donut chart is to add your chart to a dashboard and float a circle with a transparent background over your pie chart. It is very important that you use a .png file so that your corners are clear and you will be able to see the underlying chart.
Tableau Donut Charts 4
Feel free to use this .png file for your inner circle if you don’t already have one.
donut chart center
Finally, I mentioned earlier that I don’t mind donut charts because the real estate available in the inner circle can be used to communicate additional context either through icons or text. In this case, I may make a calculated field to determine the percentage of our sales goal we have obtained. This calculation can then be used to create a text sheet that can be floated over the donut chart to finalize the view.
Final Product
Tableau Donut Charts 5

Source: Evolytics